28 April 2023

April Energy Market Charts

April Charts - See the latest technical analysis of the UK wholesale energy markets

To understand an object, to truly be aware of it’s structure and dimensions requires viewing it from different angles. Energy markets are no different. While our monthly reviews cover the fundamental news that affects UK gas and electricity prices, our charting articles offer a technical perspective into how the wholesale market is moving. 

This week we’re going to look at the UK wholesale gas market and analyse the chart in a couple of different time frames.


The Daily Chart

Each candlestick represents one day of wholesale gas trading


In this chart we can see the short-term trend has been moving downwards and that any price increases have been short-lived. The most recent upward movement – at the beginning of April – failed to match the highs from the previous rise (from the 10th of March). This failure to make a new high suggests that price rises may be limited in the short-term. 

It’s possible prices stabilise around this level, but it will be worth keeping an eye on whether we see a new low in the coming days. The current price levels are close to retesting the low set on the 20th of March. A close below this level would show prices are continuing the 2023 trend of falling and are yet to stabilise.

With the 2 brief spikes in price being caused by fears over potential gas shortages next winter, the speed at which the price came down suggests those fears are not currently widely held across the market. 


The Weekly Chart

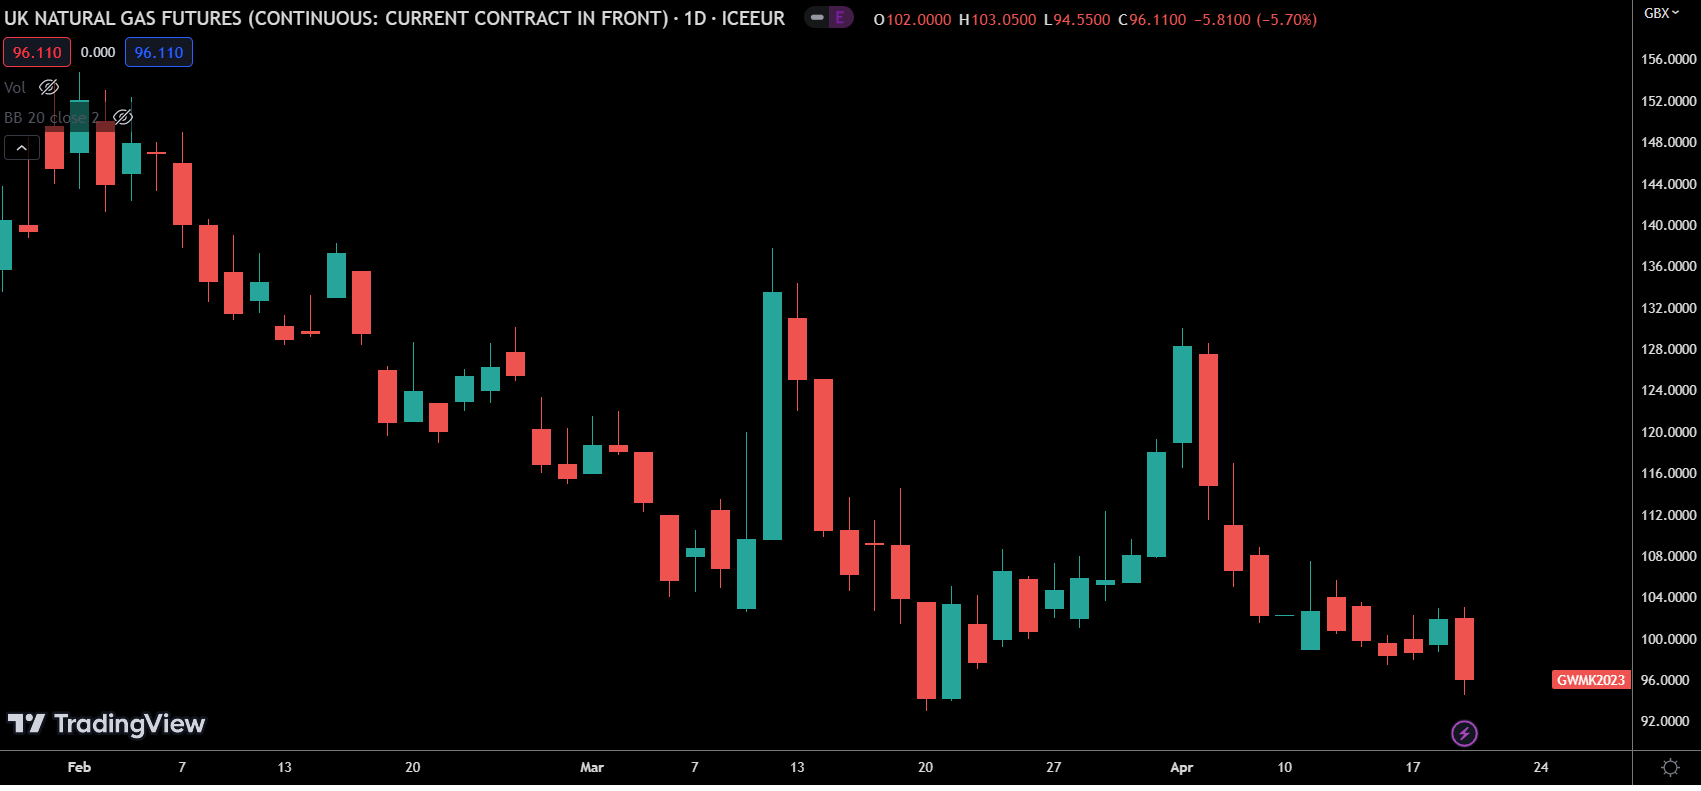
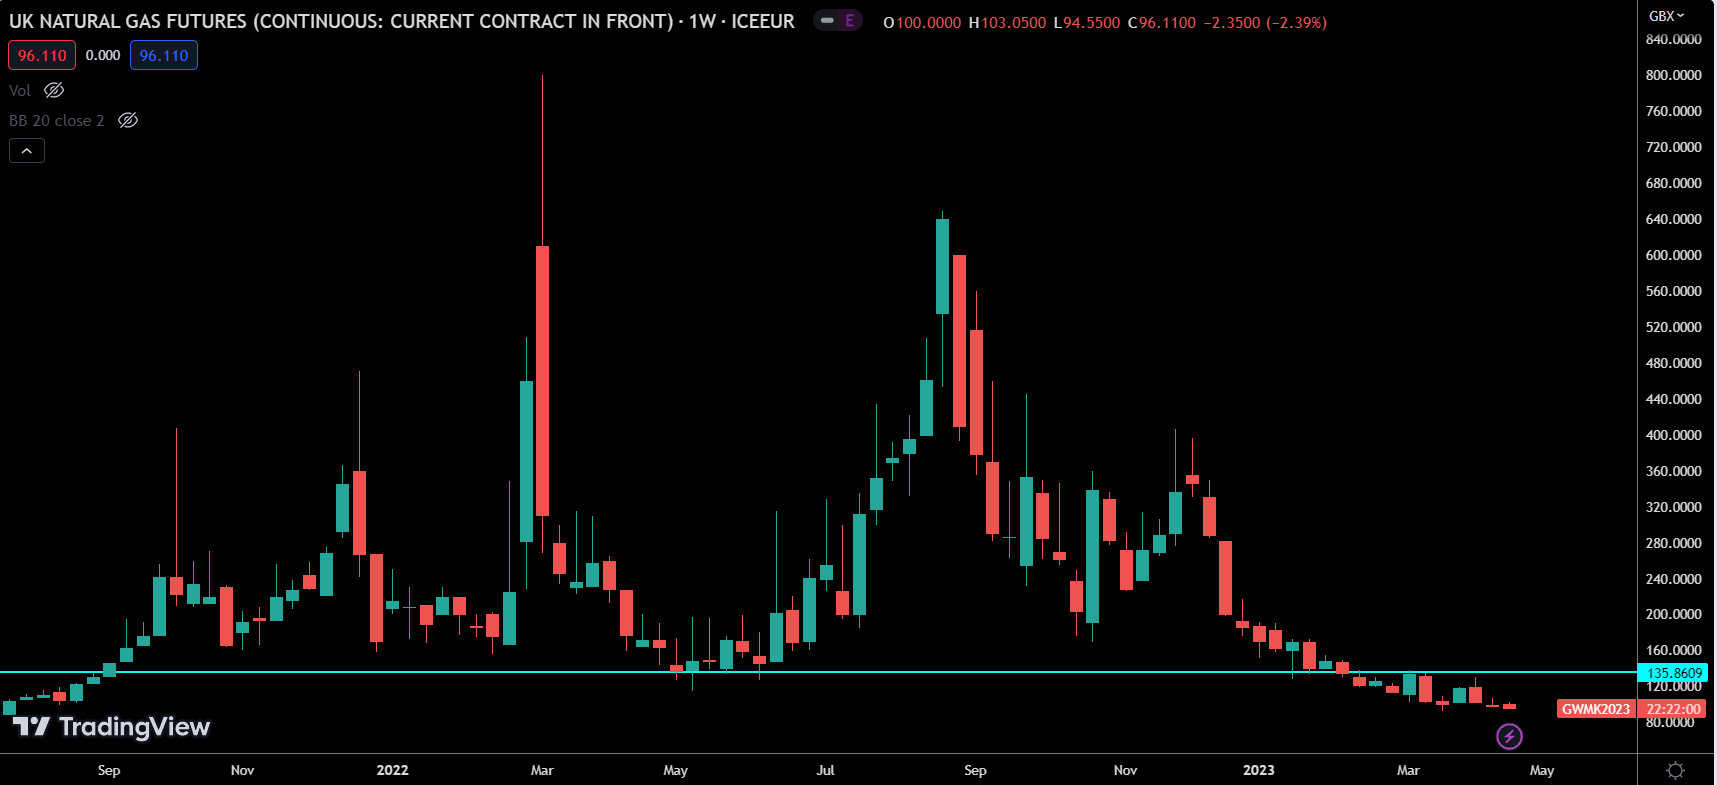
Each candlestick represents one week of wholesale gas trading


The weekly chart shows us that prices are now below the 2022 levels – they are currently at a level last seen in July of 2021.

The blue line on the graph represents the lowest closing price of 2022. At present, we have seen the price stay below that level for 6 consecutive weeks. 

While -- compared to most of the previous decade -- the market may be a bit more cautious and wary of negative news, we are seeing something of a return to normality in the wholesale levels. 

For many months now there has been a view that the market was overbought and that prices would need to come down. We are now approaching a level where it seems that prices are likely to stabilise. This will represent a good time for buyers to lock in a % of future purchases knowing that – while the momentum is to the downside -- the risk to the upside now outweighs the risk of further decreases given how far the price has already fallen. It is hard to see of any significant event which would cause a large move down in price and further drops will likely be steady and incremental, whereas a major geopolitical event impacting supply could cause a spike in prices. Even if this is seen as an unlikely event, buyers are far more wary of such an event than they were 2 or 3 years ago.


For the more cautious buyer -- one who still has significant fears about geopolitical unrest impacting the wholesale prices -- this could even be seen as a time to make substantial purchases. Whilst we may not be at the absolute low for this cycle, timing the very low or high is a difficult thing to do. 

Given the volatility of prices over the last 18 months it seems reasonable to expect some cautionary purchasing any time a new recent low is achieved.


We will keep watching the charts closely, and if you need any advice in navigating the energy markets, feel free to contact one of our expert advisors at Seemore Energy to help with your energy monitoring, planning, or purchasing needs.

by Craig Watson 27 March 2026
With consumer spending declining and OFGEM raising their price cap, you would be forgiven for seeing February as a month where negative news was at the forefront, but in the energy markets, this was not the case.
by Craig Watson 27 March 2026
In a year that began with falling energy prices, there were recurring catalysts that led to prices climbing steadily higher. Geopolitical uncertainty and the perennial threat of escalating conflicts meant fear would maintain a constant presence in the wholesale markets. We will look back at the key energy stories from 2024, and how the energy markets are likely to shape up in 2025. Quarter 1  The year began with cautious optimism as the UK’s gas reserve levels were healthy and prices for the Summer’24 season were in freefall. In February, prices pulled back to their lowest levels since 2021, and for the first time in a while, we identified that there was greater potential for upside risk than for further downward price movement: “ there now (exists) an asymmetrical element of risk should the market encounter a supply-side problem of significance. ” During February we had advised customers on flexible contracts that this was an ideal time for making purchases. March would see prices begin to ascend again as international conflict would create problems with LNG imports, and we would highlight the geopolitical risks as an area for concern moving forwards: “ fears remain and there are potential negative catalysts that could lead to prices rising further, with the main factors to watch out for being based on geopolitical unrest. “ For a business that purchases their energy in advance, this quarter was the optimal time for purchasing during 2024. In February, electricity prices for Winter’25 were down to 7.75p/Kwh, and as low as 6.05p/Kwh for Summer’25. Winter’25 ended the year with prices above 11.1p/Kwh, with Summer’25 prices exceeding 9p/Kwh. For a company that uses 500,000Kwh of electricity per month, the difference between buying at the February low point compared to today’s prices would represent a yearly saving of over £200,000.
Show More